







Starter
For freelancers and small teams.
$ 24 /mo
Billed monthly · cancel anytime
Platforms3
Accounts10
Import Facebook Ads data into Google Sheets and keep it there: campaigns, ad sets, ads, placements, and creative performance, refreshed on the schedule you choose.
The Catchr add-on writes into the spreadsheet you already use, next to your other ad platforms, so your formulas, pivot tables, and client tabs keep working.


Trusted by teams that would rather improve campaigns than copy cells.










Add Catchr to Google Sheets from the Google Workspace Marketplace, then open it from the spreadsheet where you want to work.


Open Google Sheets and start the Catchr add-on. Sign in with your Catchr account.
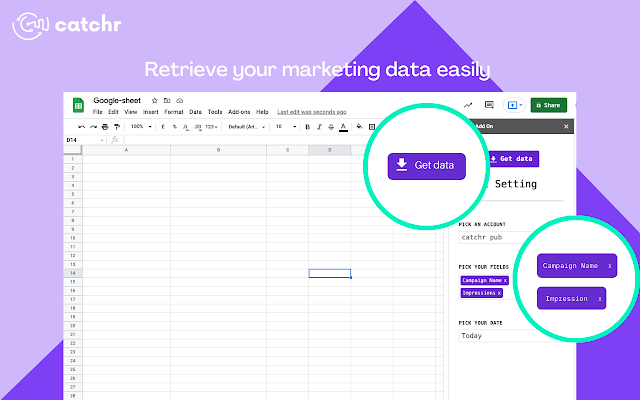

Run your first import, then schedule automatic refreshes to keep your spreadsheet up to date while your formulas, charts, and pivot tables continue working.
Available metrics
Available dimensions


What our customers say about us.
After three years of use, Catchr has become essential for both our teams and our clients. So far, it has been our best solution for compiling and analyzing data from different advertising platforms. It’s easy to set up, and the customer service is responsive and excellent.

With Catchr’s automated API, we can finally collect and centralize all advertising data, connect it with booking information, and calculate the real ROAS for our restaurant clients. It gives them full visibility, more autonomy, and the ability to optimize campaigns to maximize ROI.

The solution is a real game changer, providing optimal time savings for our data reporting. The major strength of the solution is their highly responsive and professional support.

No. Catchr imports Facebook Ads performance data, including lead counts, cost per lead, and on-Facebook leads from Messenger and Instant Forms. It does not export the contact details people typed into your lead forms. For the submissions themselves, use a lead retrieval integration, such as Meta's native Google Sheets integration where available. You can use both: collect lead records in one tab and report on the cost of acquiring them in another.
They serve different reporting needs. Meta's native integration connects Instant Form lead records with Google Sheets for lead follow-up. Catchr imports advertising performance, such as spend, impressions, clicks, and conversions, into your spreadsheet. You can select the ad accounts you have access to, schedule refreshes, and report alongside your other platforms. Use a lead integration to manage individual submissions and Catchr to measure campaign performance.
Yes. Catchr lets you schedule each Google Sheets query to refresh hourly, daily, weekly, or monthly. By default, a refresh replaces the query's imported data; append mode is also available. Keep query output in a dedicated raw-data tab with room to grow, and put formulas, charts, and pivot tables in separate reporting tabs. Use ranges that can accommodate new rows and check chart and pivot ranges as your dataset grows.
They should align when the reporting settings match. Check the date range, account timezone, attribution window, and reporting level, and compare the same metrics and filters. Allow for reporting delays and later conversion updates. Meta stopped returning 7-day view and 28-day view attribution windows through the Ads Insights API on January 12, 2026, including for historical queries. Also avoid adding campaign totals to ad set or ad totals: those levels can describe the same conversions and would double count them.
As far back as Meta makes it available for the fields and breakdowns you select. Aggregate totals are available for up to 37 months. Breakdowns of unique-count fields and hourly breakdowns are limited to 13 months, while frequency breakdowns are limited to 6 months. Requests outside the applicable window may fail or return no data. Preserve older results in an archive tab or a separate file: refreshing a rolling date range does not automatically keep a permanent history.
Google Sheets supports up to 20 million cells per spreadsheet, with the increase still rolling out to some accounts in September 2026. The limit covers all tabs combined. Ad-level data split by day, placement, and country can grow quickly, and performance may slow before you reach the ceiling. Import at the level you actually report on, select only the fields you need, and keep one workbook per client. For longer histories or very large datasets, consider a warehouse such as BigQuery.
Yes. Catchr exposes creative fields alongside dimensions such as placement, publisher platform, age, gender, country, and device. Creative fields include IDs and names, ad body text, image URLs, and thumbnail URLs when Meta makes them available for the ad format. Availability varies: for example, the standard creative body field is not supported for video post creatives. Meta also restricts which breakdowns can be combined, so you may need separate queries for different creative, audience, and placement views.
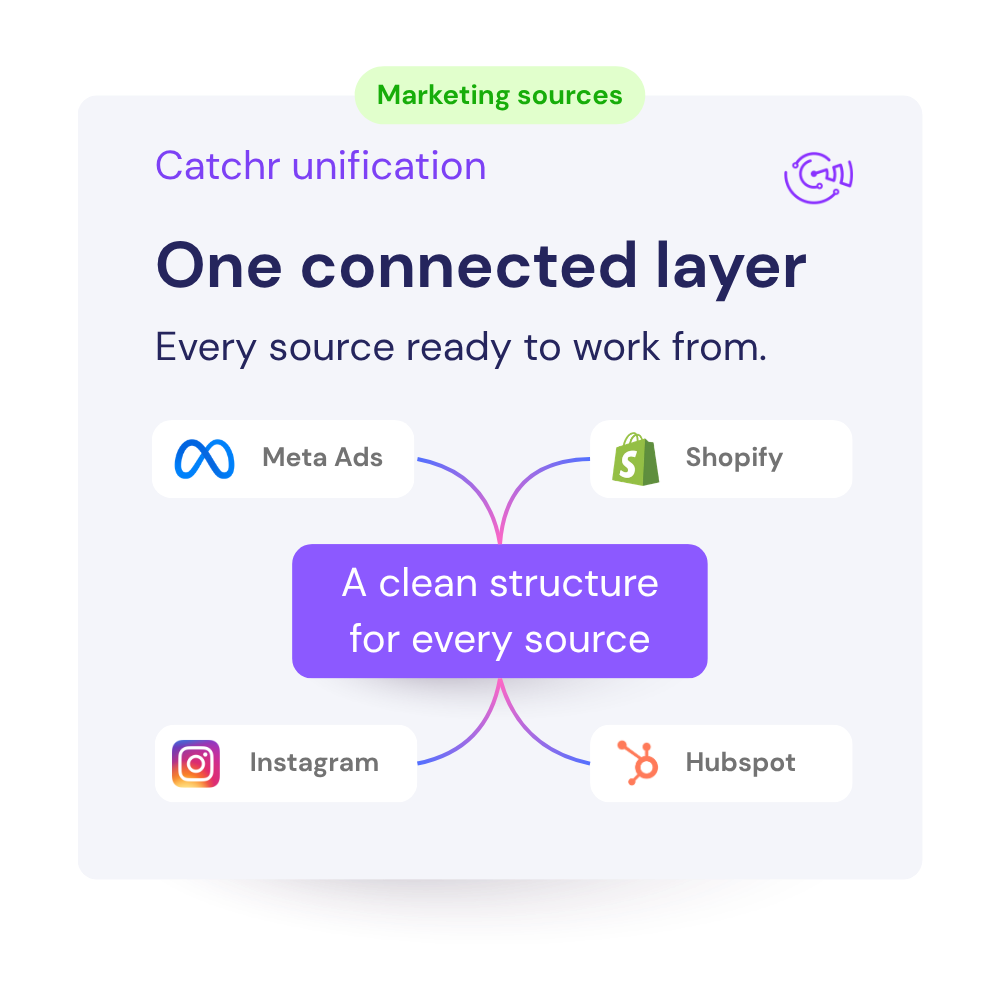
Yes. You can create a separate data request for each source in the same spreadsheet, including Facebook Ads, Google Ads, GA4, TikTok Ads, Shopify, and HubSpot. Give each request its own output range, preferably in a dedicated source tab, and set its refresh schedule. Use reporting tabs to bring the results together. Scheduled queries run in sequence, so a slow request can delay later refreshes.
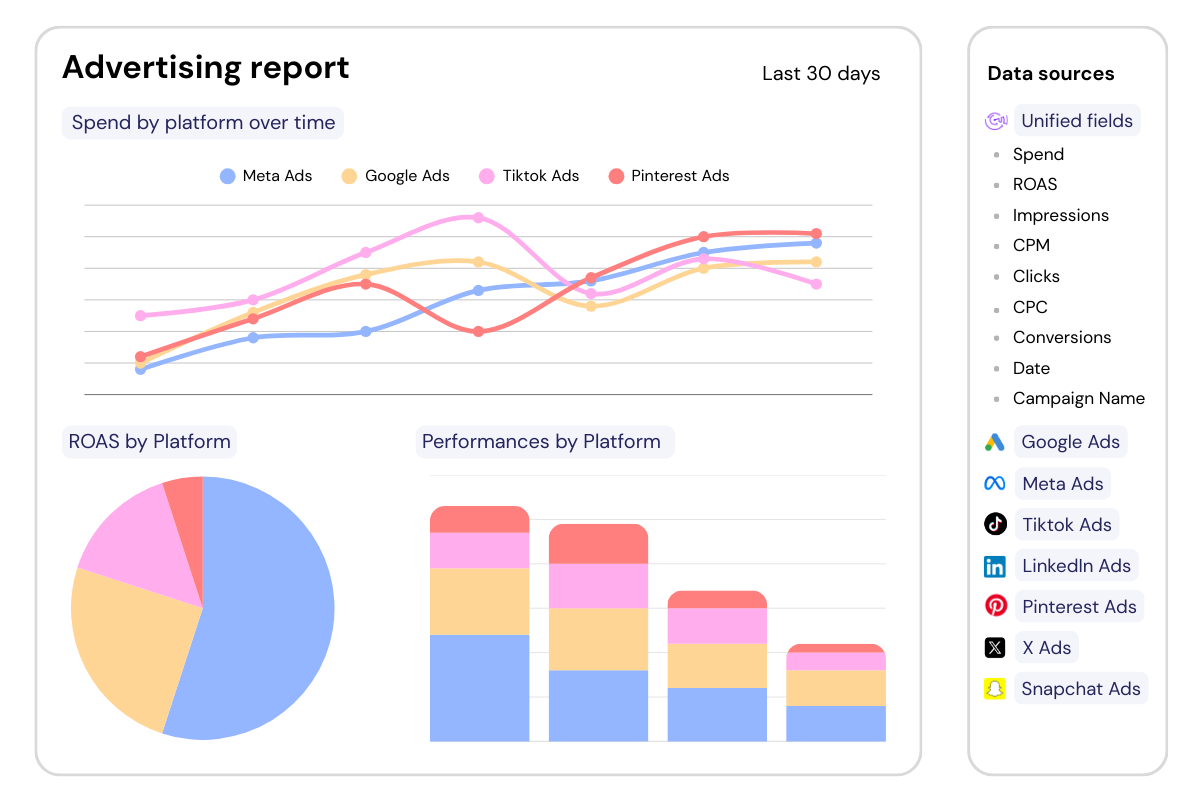
No. Keep platform-specific fields inside their own source tabs. In your shared reporting tabs, map only KPIs with comparable definitions, such as spend, impressions, clicks, CTR, CPC, and conversions. Check currency, click definitions, and conversion attribution before combining sources. Recalculate ratios such as CTR and CPC from the combined totals. Keep source-specific measures, such as Meta results by objective, in the Facebook Ads tab; campaign, ad set, date, and placement are dimensions, not KPIs.
A practical structure is to create one workbook per client. Inside each workbook, use one raw tab per source and separate working tabs for daily monitoring, budget pacing, cross-channel performance, and the client summary. For larger accounts, separate tabs can also be created by country, brand, business unit, or campaign objective.
Yes. The imported data behaves like other spreadsheet data, so Google Sheets sharing, permissions, and version history apply. Give your team edit access and your client view-only access to the workbook. Protected sheets and ranges can restrict editing, but they do not create private tabs or separate viewing permissions. If a client should only see a summary, share a separate reporting file.
No. The Catchr add-on lets you choose a data source, select metrics and dimensions, and import the result from inside Google Sheets. There is no Apps Script to write and no Marketing API call to build.
Our team is always here to answer any questions you may have about our data connector.
Connect your marketing platforms and build a data workflow your entire agency can use.