Blog post
Catchr
Power BI
Facebook Ads

Welcome to this comprehensive tutorial where we'll guide you through the process of connecting your Facebook Ads data to PowerBI via Catchr. By the end, you'll be able to effectively visualize and analyze your marketing metrics within the powerful PowerBI environment.
To begin, navigate to the Catchr homepage and select Sources from the left-hand menu. Then, click on Add a Source situated at the top right corner of the page.
Choose Facebook Ads as your platform of interest and follow the necessary steps to authenticate and establish the link between Catchr and your Facebook Ads account.


In PowerBI Desktop, you can commence the importation of data from various sources. In this scenario, a web data source is employed to amalgamate data from Facebook Ads.


As PowerBI imports your data, a brief interval may occur. Once finalized, PowerBI Query Editor can be utilized to refine your data further. Subsequently, you're all set to start crafting your dashboard with the newly imported Facebook Ads data, publish it, and share it with your team or stakeholders.
For PowerBI Web App usage, post publishing in PowerBI Desktop, locate the dataset in the web app to start generating your report.
A brief note to conclude, as you navigate through Catchr and PowerBI, remember these tools are designed to maximize your marketing data’s potential. This integration facilitates better data-driven decisions, enhancing your marketing strategies.
PowerBI provides an extensive range of capabilities that can transform how you interpret Facebook Ads metrics. Leveraging PowerBI’s analytical prowess, you can create rich visualizations to unravel insights from the wealth of data Facebook Ads offers.
For instance, the "Clicks" metric, when visualized in PowerBI, can reveal click trends over time, or how clicks correlate with various ad campaigns or demographics. You can identify peak performance periods and tailor future campaigns to capture audience attention during those times. Similarly, "Conversion Rate" can be dissected to understand which ads drive the highest conversions, guiding budget allocation for maximum ROI.
To dive deeper into the various metrics you can pull from Facebook Ads into PowerBI, visit Catchr's Facebook Ads Metrics. This resource outlines available metrics like "Mobile App Purchases," "Leads," "Impressions," and more, each slotting into your analysis to form a comprehensive performance profile of your advertising efforts.

Start using Power BI with a ready-to-use template
Get the template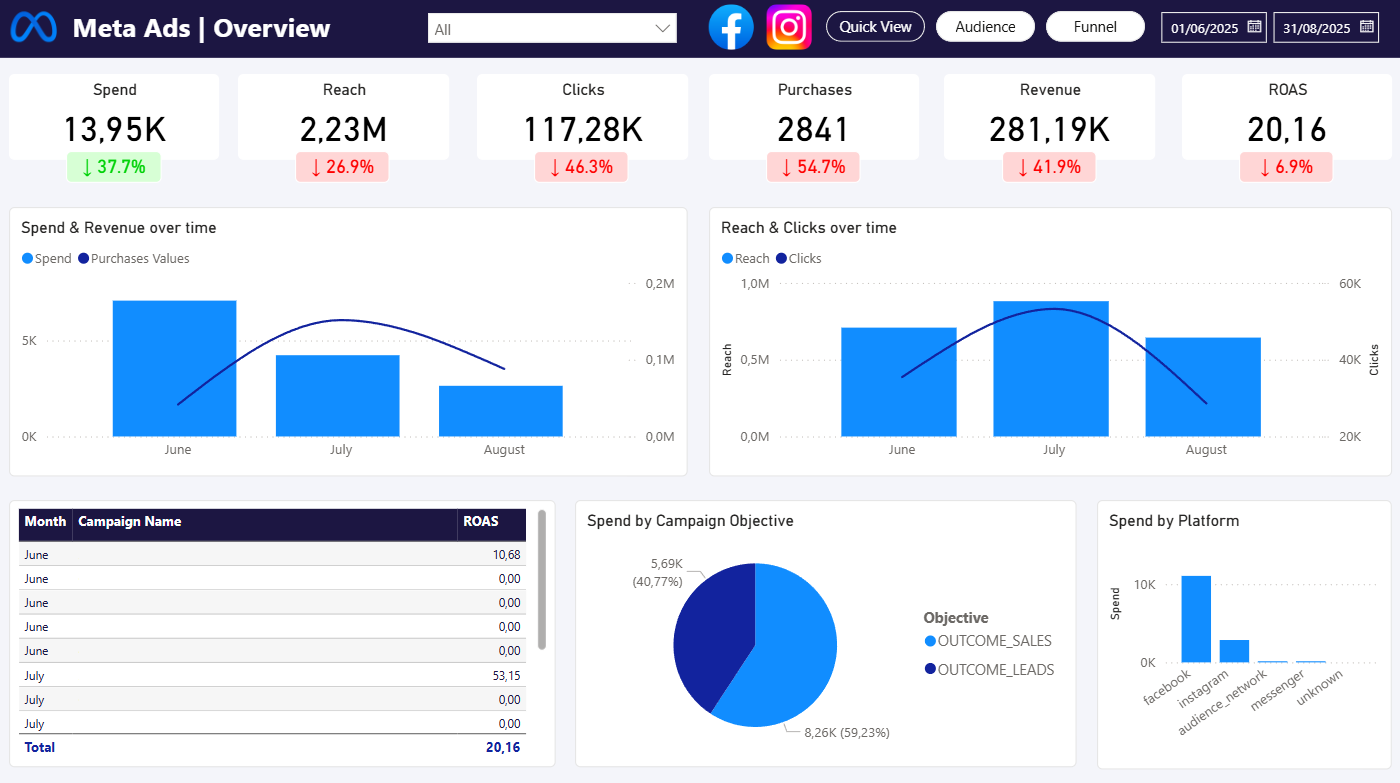
Start analyzing your data with a Power BI template
Catchr provides free dashboard templates to help you start analyzing your data on Power BI — 20+ available templates!
See all the Power BI templates


