blog post

Import your Google Analytics 4 data to Google Sheets : How-to, metrics and more

Florian Cabirol
January 31, 2024
| Lastest update
September 11, 2024
Import your Google Analytics 4 data to Google Sheets : How-to, metrics and more

Quick steps to create a Google Analytics report with Google Sheets:

You can easiliy create a Google Analytics report following this step :

  1. Get informations from the data integration from our Google Analytics connector.
  2. Create a source on catchr.io.
  3. Download our Google Sheets extensions.
  4. Configure and run your request
If you need more informations, you can follow the tutorial.

How to install Google Sheets Catchr Add-on.

To start exporting your Google Analytics data to Google Sheets, you need to install the Catchr add-on. You currently have two options :

Option A: Via the marketplace:

  1. Visit the Catchr Add-on page on the Google Workspace Marketplace and click "Install."
  2. Grant the necessary permissions for the add-on.
  3. Upon successful installation, open a Google Sheets to proceed.
Connect Google Sheet to Facebook Ads
Install Catchr Google Sheets Add-on

Option B: Directly within a Google Sheets:

  1. Open a new Google Sheets.
  2. In the top menu, click "Extensions", then hover over "Add-ons" and select "Get add-ons."
  3. Search for "Catchr" and choose "Catchr - data connector."
  4. Click "Install" and grant the required permissions.
  5. Close the installation pop-up when completed.
  6. Start using the Catchr add-on.
Install Catchr Add-on for Google Sheets

Once you have installed the add-on, you can start making requests.

The tutorial

Quick steps to create a Google Analytics report with Looker Studio:

You can easiliy create a Google Analytics report following this step :

  1. Get informations from the data integration from our Google Analytics connector.
  2. Create a datasource and new report on Looker Studio.
  3. Choose your metrics and dimensions.
  4. Use charts with your metrics and dimensions.
If you need more informations, you can follow the tutorial. You can also find a template for Google Analytics at the end of the page.

The tutorial

Quick steps to create a Google Analytics report with PowerBI:

You can easiliy create a Google Analytics report following this step :

  1. Get informations from the data integration from our Google Analytics connector.
  2. Create a source on catchr.io.
  3. Configure your request on the PowerBI request manager.
  4. Copy the given URL in PowerBI
If you need more informations, you can follow the tutorial. You can also find a template for Google Analytics at the end of the page.

The tutorial

This tutorial is designed to guide marketing professionals on how to seamlessly integrate their Google Analytics data with Google Sheets using Catchr. By following these steps, you will be able to visualize and manipulate your marketing data more effectively, enabling you to make data-driven decisions with ease.

How to Connect Your Google Analytics Account to Google Sheets

Add a Source on Catchr

Begin by navigating to the Catchr homepage. On the navigation menu to the left, select Source, then choose Add a Source located at the top right corner of the screen. From here, select Google Analytics as the platform you wish to connect, and proceed with the necessary steps to identify and authenticate the integration between Catchr and Google Analytics.

Adding a source on Catchr interface

Create a New Query

Open your Google Sheets document and locate the Catchr plugin in the menu bar. Click on Catchr, then select New Query to initiate the creation of a new data query dedicated to importing your selected Google Analytics data.

Select Your Data Source

In the query creation window, select Google Analytics as the source of your data. If Google Analytics does not appear in the list, click on the "+" icon to add it as a new source.

Data source selection dialog

Select Your Account(s)

Proceed to the "Select account(s)" tab, and pick the Google Analytics account(s) you are interested in extracting data from.

Account selection interface

Choose Metrics and Dimensions

Continue by selecting the specific metrics and dimensions you wish to include in your Google Sheets by navigating to the respective tabs named Metrics and Dimensions.

Metrics:

  • Pageviews: Tracks the total number of page views.
  • Unique Pageviews: Counts distinct visitors per page.
  • Bounce Rate: Measures the percentage of single-page sessions.
Selecting metrics in Catchr

Dimensions:

  • Country: Identifies the visitor's country of origin.
  • Device Type: Specifies the category of device used.
  • Browser: Indicates the web browser utilized.
Selecting dimensions in Catchr

Set Date Range

Choose your desired date range for data extraction by visiting the Date Range section. Catchr provides predefined options like "Last month" or "This year," but also allows for custom date range selection.

Setting date range for data extraction

Apply Filters

To get more precise data, apply filters under the Filters tab by providing the specific field, operator, and value for your filter criteria.

  • Field: country
  • Operator: equals
  • Value: United States
Applying filters in Catchr

Schedule & Customize Data Refreshness

Finalize your setup by customizing your data refresh options under the Options tab, where you can schedule automatic refreshes and decide whether to append or combine rows for your queries.

Setting data refresh options

In conclusion, following these steps will allow you to successfully integrate your Google Analytics data into Google Sheets, where you can further analyze and leverage your marketing insights.

Example of Google Sheets You Can Create to Use with the Google Analytics Source

Using Google Analytics data within Google Sheets presents virtually endless possibilities for analysis and reporting. Here are a few example sheets you might create:

  • Daily Performance Dashboard: A sheet that tracks daily website traffic, engagement metrics, and conversion rates. By setting up charts and pivot tables, you can visualize trends over time.
  • Audience Demographics Report: Create a detailed report on your website's audience including age, gender, location, device, and browser. This can help you tailor your content and marketing strategies more effectively.
  • Campaign Analysis Sheet: Compare the performance of various marketing campaigns by pulling data such as campaign ID, impressions, clicks, and conversions directly from Google Analytics into Google Sheets. This can help in determining ROI and planning future marketing strategies.
  • Content Analysis Tool: Evaluate which pages or blog posts are performing the best in terms of views, time on page, and bounce rate. Use this data to guide your content creation efforts.

By leveraging the power of both Google Analytics and Google Sheets, marketers can create custom dashboards and reports that fit their specific needs, making data-driven decisions faster and more accurately.

Empower your Marketing data analysis
Discover +50 connectors to import your Marketing data into your favorite dashboard tool! Unlock instant data integration with Catchr's no-code feature – no IT team required!
Start your free trial!

All your marketing data on Google Sheets

Build Google Sheets dashboard with your different marketing data and track all the essential KPIs.

Start your free trial!
Keep an eye on your data

Connect your Google Analytics data to Google Sheets thanks to Catchr's no code connector!

Start your free trial!
Need a clearer view of your marketing data?
Unlock your free Looker Studio dashboard template for from a collection of +50 stunning designs. Elevate your data visualization!
Get it for free
Need a clearer view of your marketing data?
Unlock your free Power BI dashboard template from a collection of stunning designs. Elevate your data visualization!
Get it for free
Need a clearer view of your marketing data?

Unlock your free Google Analytics 4 dashboard template for Power BI from a collection of stunning designs. Elevate your data visualization!

Get it for free
Need a clearer view of your marketing data?

Unlock your free SEO overview dashboard template for Looker Studio from a collection of +50 stunning designs. Elevate your data visualization!

Get it for free

Bonus : Your free SEO overview Template

In this Google Analytics template, you will find all the metrics and dimensions you would need to get a better view of your data.

If you need more templates, you could look at our looker studio template gallery.

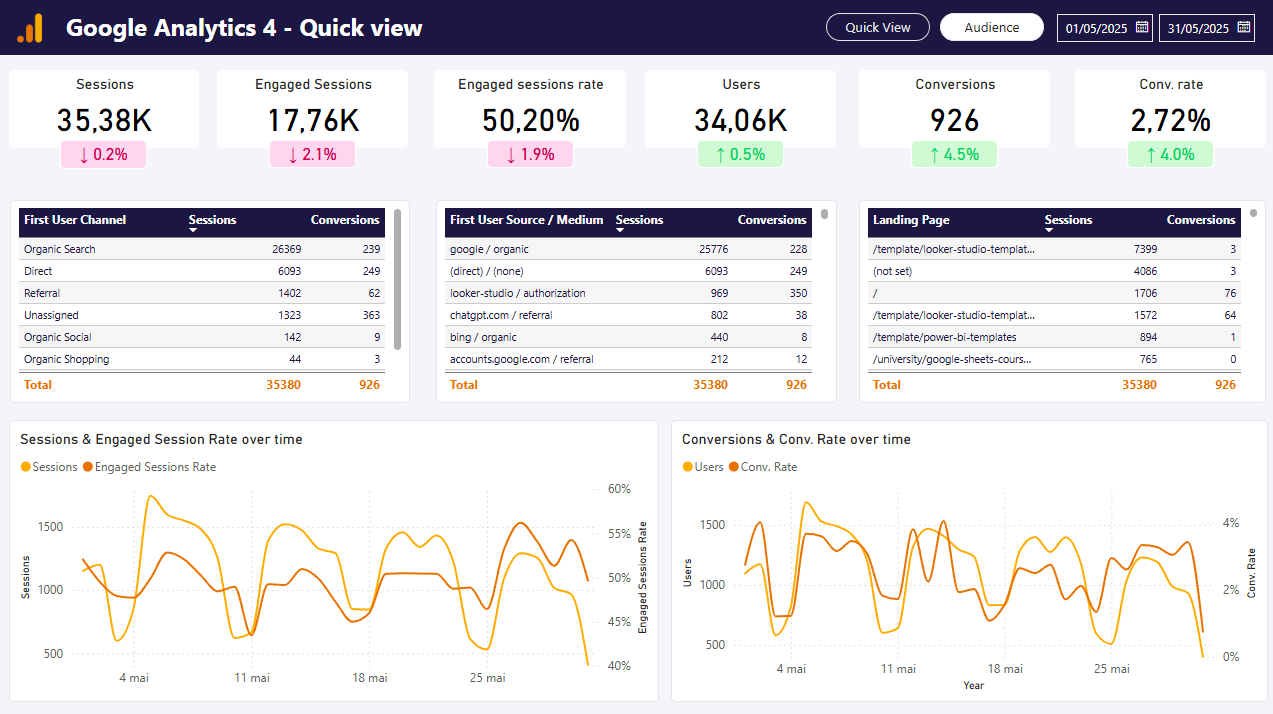
Bonus : Your free Google Analytics 4 Template for PowerBI

In this Google Analytics template, you will find all the metrics and dimensions you would need to get a better view of your data thank to our integrations.

If you need more templates, you could look at our PowerBI template gallery.

Unlock Insights with Style!

Transform your marketing data into stunning dashboards.

Integrate, visualize, and impress with Catchr's seamless dashboards. Elevate your data game now!
Build your first report
14 days free-trial - No credit card required 🎉

More blog post about Google Analytics