This banner can be used to inform vistors of something important.
Learn more
Blog post
Marketing Dashboard

You can easiliy create a report following this step :
To start exporting your data to Google Sheets, you need to install the Catchr add-on. You currently have two options :
Option A: Via the marketplace:

Option B: Directly within a Google Sheets:

Once you have installed the add-on, you can start making requests.
Whether you're a small business or a big agency, you will always need someone to monitor your data and the results of your marketing actions.
Keeping a close eye on key performance indicators (KPIs) allows you to gain insights into customer behavior, optimize your campaigns, and make informed decisions that drive growth and success.
This guide will walk you through the steps to develop a compelling marketing report that delivers actionable insights and keeps stakeholders, clients, or your team informed.
A marketing report is a critical element of any effective marketing strategy. It involves collecting, analyzing, and presenting data related to marketing activities.
There are two main reasons why you need a marketing report:
You can create marketing reports at different times depending on your needs:
One of the things we are doing at Catchr is having a big Looker Studio dashboard that prints our principal KPIs so we can see if everything is going great every day.

To create an actionable marketing report, we recommend starting with the simple but powerful Who, Why, What framework:
Starting with clear goals ensures that you won't waste time reporting irrelevant numbers or chasing data that will not impact your marketing decisions. This approach ensures resources directly support business goals—a point reinforced by Nielsen's latest study, which reveals marketers struggle with monthly reporting consistency across channels.
So, let's focus on each step now.
Your marketing report is valuable for anyone who needs clear insights to make informed business decisions. At each level of your company, a person could (and should) have a report to know what actions were taken and how to debrief them.
Furthermore, a marketing report could help you rapidly examine a problem in your campaign.
For example, for a marketing agency that makes PPC or SEM campaigns, many levels of people could be involved :
Another example could be an E-commerce business :
Once you have defined who your marketing dashboard is for, you need to focus on "why they need it."
Once you have defined who your report is, you need to determine the primary goal of the report you are building.
Some examples could include :

Now that you have the Who and the Why, we must dive into the What. This could be a dark place because of the complexity of KPIs and their respective silos.
Each business has its own KPI to monitor in near real-time. If you do not have one, you should always focus on it and try to answer the question, "What are the main goals of my business ?"
These KPIs are the cornerstone of your marketing report, providing a clear reflection of your business objectives and precisely tracking your progress toward achieving them.
For an e-commerce business, it could be the number of sales and the total turnover. For a SaaS business, it could be the number of subscribers.
Each KPI is driven by its own set of influencing metrics that affect its performance.
For example, your website's loading time could have a big impact on your sales, so monitoring it could be a really good KPI to track.
At Catchr, we always apply the rules of three. Each department monitors three KPIs that could have three KPI that have an impact on it, etc…
For example, our marketing department has three KPIs:
For the Visitor's KPI, we have three other KPIs to watch :
And for SEO :
With this method, we are not bloated by the KPI, and each team/person is focused on and responsible for their KPI.

Some commons KPI used internally by our teams are :
Marketing KPI:
Social Media KPIs:
Email Marketing KPIs:
Website Traffic KPIs:
.svg)
You can find more specific marketing KPI by platform in our blog section :
Now that you have all the information you need, it's time to build the marketing report.
One of the most challenging tasks in creating your marketing report is to get all the data you need in the same place.
This is precisely what Catchr is built for. Without tools like Catchr, extracting, copying/pasting, and formatting your data will take a lot of time. These repetitive actions are prone to errors, and time-consuming, and prevent your team from making quick, data-driven decisions based on fresh and accurate insights.
But with Catchr, you always prioritize real-time data updates by automating the extraction and synchronization of your data.
Catchr is compatible with a lot of different data sources:
{{cta-catchr}}
Now that you've identified who your marketing report is for, why it's essential, and what it should contain, you need practical tools to bring everything together clearly and intuitively.
There are two kinds of tools that you can use to analyze, visualize and understand your data : Spreadsheet and Visualization Tools.
Spreadsheet tools are essential for organizing, analyzing, and visualizing your marketing data efficiently. They offer intuitive interfaces for data entry and analysis, making them suitable for both quick insights and in-depth analytics. Two of the most popular spreadsheet tools include Google Sheets and Excel, each tailored to different business needs and user skill levels.
Google Sheets
Ideal for smaller teams or startups, Google Sheets is a versatile and user-friendly spreadsheet tool. It's perfect for quickly organizing marketing data, performing fundamental analysis, and creating simple visualizations. Its real-time collaboration features make it easy for teams to edit and review data simultaneously.
Excel
Excel is a powerful tool widely used for marketing analysis. It's ideal for extensive data crunching, advanced formulas, pivot tables, and complex visualizations. Although it requires some expertise, Excel remains a reliable choice for businesses needing robust analytics capabilities.
Interactive dashboards deliver real-time tracking capabilities, offering key benefits for monitoring marketing performance. These tools simplify complex data through visual displays, helping teams spot trends faster.
Looker Studio (formerly Google Data Studio)
Looker Studio takes reporting to the next level by creating interactive, dynamic dashboards. It directly integrates with Google Analytics, Google Ads, and many other platforms, offering advanced visualizations, interactive charts, and automated data updates.
For practical examples, see our Google Looker Studio tutorial that breaks down dashboard creation for traffic analysis and sales pipelines.
Tableau
Tableau is one of the most intuitive business intelligence (BI) tools on the market, and it is known for its exceptional visualization capabilities. It effortlessly handles large datasets, transforming complex data into clear, actionable insights. It suits larger organizations needing powerful data visualization and dashboarding features.
Power BI
Microsoft's Power BI offers advanced reporting and dashboard creation with strong integration into the Microsoft ecosystem. It's an excellent tool for businesses already embedded in the Microsoft environment and looking for detailed insights and advanced analytics capabilities.

This SEO Overview Looker Studio Template provides a comprehensive visualization of essential SEO metrics to effortlessly track your website's organic performance.
You can analyze key indicators such as organic traffic, keyword rankings, impressions, clicks, and more, helping to streamline reporting and enhance decision-making.

This Meta Ads Looker Studio Template helps you to visualize key performance metrics like Spend, Impressions, Reach, and ROAS in one unified dashboard.
Clearly track budget distribution and campaign objectives to understand what's driving success, making informed decisions simpler and faster. Ideal for marketing teams, agencies, and freelancers, this intuitive template reduces manual tasks, increases accuracy, and lets you dive deeper into your Meta Ads data instantly.

This Social Media Organic Overview Looker Studio Template enables you to effortlessly monitor and analyze your organic social media performance in one centralized dashboard.
Quickly track key metrics such as engagement rates, audience growth, impressions, and top-performing content across multiple platforms.

This ActiveCampaign Overview Looker Studio Template allows you to seamlessly monitor and analyze your email marketing campaigns within an intuitive, centralized dashboard.
Easily track key email performance metrics such as open rates, click-through rates, conversions, and subscriber engagement, enabling you to optimize your marketing efforts effectively.
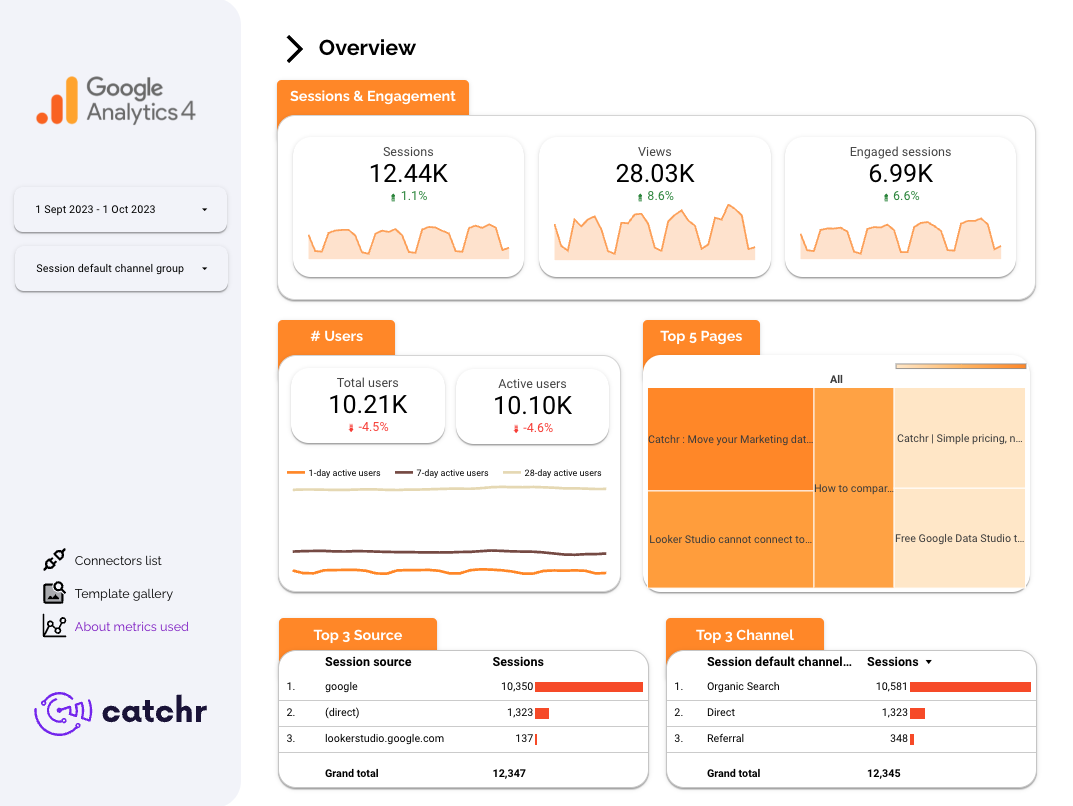
This Google Analytics 4 Looker Studio Template offers an intuitive and powerful way to visualize and analyze your website's key performance metrics using GA4 data.
With insightful dashboards featuring user engagement, traffic sources and detailed sessions information, this template empowers marketers to make informed, data-driven decisions easily.

This Google Ads Overview Looker Studio Template simplifies your Google Ads performance tracking with a clear, easy-to-use dashboard.
Quickly monitor essential campaign metrics such as impressions, clicks, CPC, conversion rates, and costs over time. Additionally, identify your top-performing campaigns at a glance to optimize spending and improve ROI.
.png)


