blog post

Import your Mailchimp emailing data to Google Sheet : How-to, metrics and more

Florian Cabirol
January 31, 2024
Import your Mailchimp emailing data to Google Sheet : How-to, metrics and more

Quick steps to create a Mailchimp report with Google Sheets:

You can easiliy create a Mailchimp report following this step :

  1. Get informations from the data integration from our Mailchimp connector.
  2. Create a source on catchr.io.
  3. Download our Google Sheets extensions.
  4. Configure and run your request
If you need more informations, you can follow the tutorial.

How to install Google Sheets Catchr Add-on.

To start exporting your Mailchimp data to Google Sheets, you need to install the Catchr add-on. You currently have two options :

Option A: Via the marketplace:

  1. Visit the Catchr Add-on page on the Google Workspace Marketplace and click "Install."
  2. Grant the necessary permissions for the add-on.
  3. Upon successful installation, open a Google Sheets to proceed.
Connect Google Sheet to Facebook Ads
Install Catchr Google Sheets Add-on

Option B: Directly within a Google Sheets:

  1. Open a new Google Sheets.
  2. In the top menu, click "Extensions", then hover over "Add-ons" and select "Get add-ons."
  3. Search for "Catchr" and choose "Catchr - data connector."
  4. Click "Install" and grant the required permissions.
  5. Close the installation pop-up when completed.
  6. Start using the Catchr add-on.
Install Catchr Add-on for Google Sheets

Once you have installed the add-on, you can start making requests.

The tutorial

Quick steps to create a Mailchimp report with Looker Studio:

You can easiliy create a Mailchimp report following this step :

  1. Get informations from the data integration from our Mailchimp connector.
  2. Create a datasource and new report on Looker Studio.
  3. Choose your metrics and dimensions.
  4. Use charts with your metrics and dimensions.
If you need more informations, you can follow the tutorial. You can also find a template for Mailchimp at the end of the page.

The tutorial

Quick steps to create a Mailchimp report with PowerBI:

You can easiliy create a Mailchimp report following this step :

  1. Get informations from the data integration from our Mailchimp connector.
  2. Create a source on catchr.io.
  3. Configure your request on the PowerBI request manager.
  4. Copy the given URL in PowerBI
If you need more informations, you can follow the tutorial. You can also find a template for Mailchimp at the end of the page.

The tutorial

In this comprehensive tutorial, you'll discover how to seamlessly transfer your valuable Mailchimp campaign data into Google Sheets using Catchr. By the end of this guide, you'll be able to visualize and analyze Mailchimp metrics to enhance your marketing strategies directly from the convenience of Google Sheets.

How to connect your Mailchimp account to Google Sheets

Add a source on Catchr

To start, navigate to the Catchr homepage and select Source from the left menu. Next, click on Add a Source at the top right corner. Choose Mailchimp from the list of platforms and proceed with the identification steps to link Catchr with Mailchimp.

Adding a source on Catchr

Create a New Query

Launch Google Sheets and initiate a new workflow by selecting "Catchr" from the menu bar. Follow by clicking on "New Query" to create a new query for your Mailchimp data integration.

Select Your Data Source

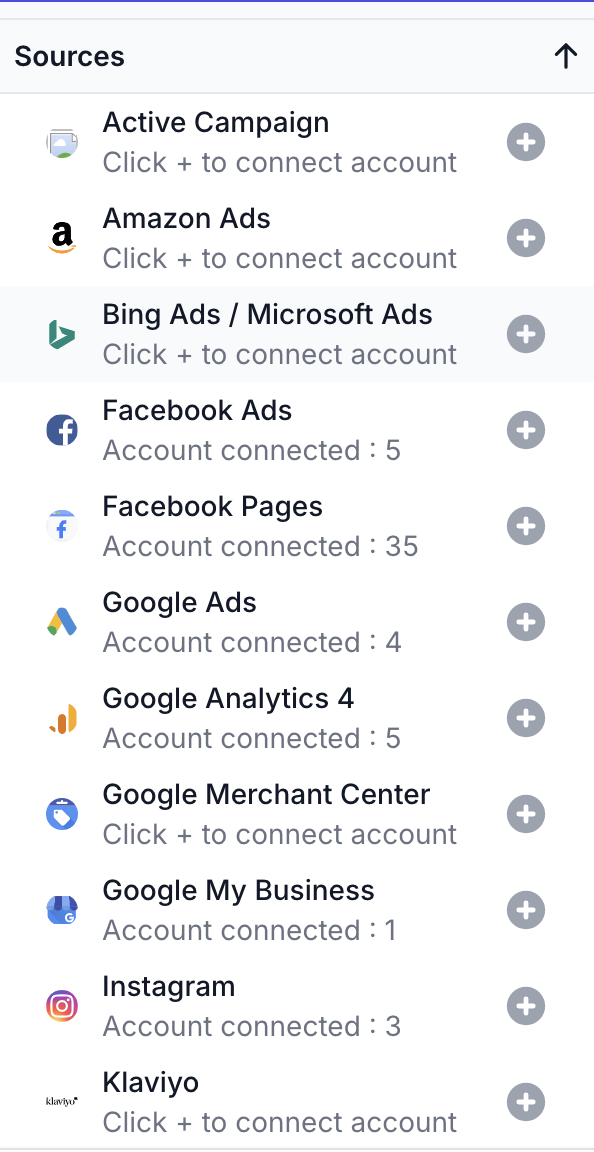
In the subsequent query tab, ensure that Mailchimp is selected as your data source. If Mailchimp isn't listed, you can easily add it by clicking on the "+" button.

Selecting your data source

Select Your Account(s)

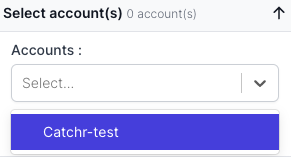
Move to the "Select account(s)" section and choose the Mailchimp account(s) you wish to import data from.

Selecting your Mailchimp accounts

Choose Metrics and Dimensions

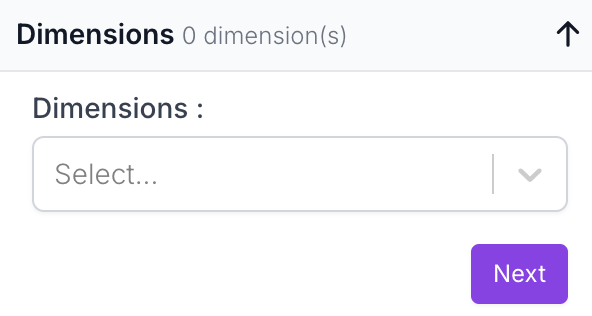
Next, access the "Metrics" and "Dimensions" tabs to specify the data you're interested in. Below are examples of metrics and dimensions applicable for Mailchimp:

Metrics:

  • Campaign Title: The title of your campaign.
  • Emails Sent: The total number of emails dispatched.
  • Open Rate: The percentage of opened emails.
Choosing metrics for your query

Dimensions:

  • Campaign Type: The kind of campaign executed.
  • Industry Type: Your campaign's industry category.
  • Campaign Send Time: When the campaign was launched.

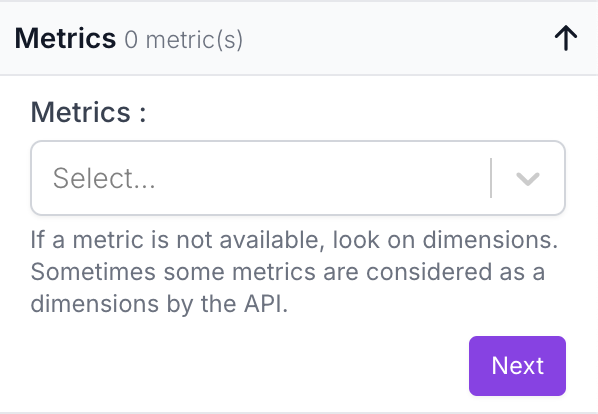
Ensure to select metrics and dimensions that align with your analysis and report-making objectives.

Choosing dimensions for your query

Set Date Range

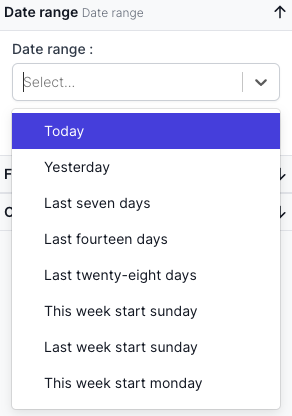
After finalizing your metrics and dimensions, proceed to the "Date Range" tab. You can either go with preset date ranges like "Last month" or "This year", or customize the start and end dates according to your needs.

Setting the date range

Apply Filters

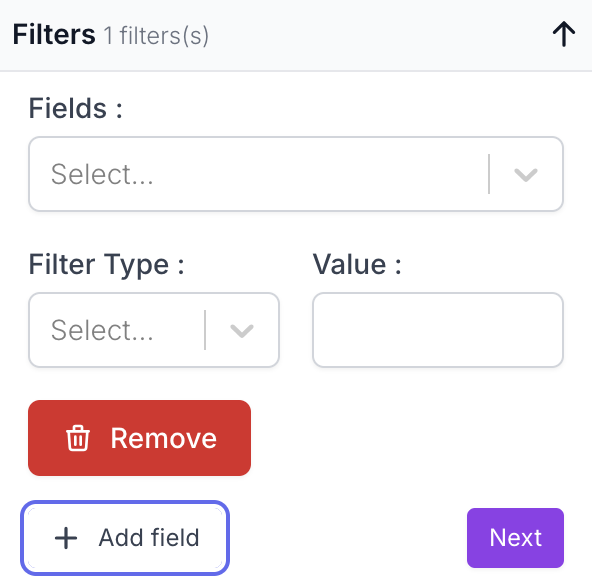
To refine your data further, you can utilize filters under the "Filters" tab by specifying:

  • Field: Campaign Type
  • Operator: Equals
  • Value: Specific campaign type you're interested in
Applying filters to your data

Schedule & Customize Data Refreshness

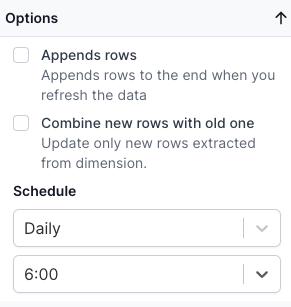
In the final step, switch to the "Options" tab to set up automatic data refreshes as per your requirements. You also have the option to append new rows or combine them within the existing data range.

Scheduling and customizing data refresh settings

This approach ensures your Google Sheets always reflects the most up-to-date information from your Mailchimp campaigns.

Example of Google Sheets you can create to use with the Mailchimp source

By connecting Mailchimp to Google Sheets, the possibilities for data analysis and visualization become vast and varied. For instance, you can create sheets that track the performance of individual campaigns over time, comparing opens, clicks, and unsubscribe rates. This can help identify what content resonates best with your audience.

Another useful application could be analyzing subscriber growth, engagement trends, or campaign efficiency by industry type. You can visualize this data using Google Sheets' robust charting and graphing tools, making it easier to share insights with your team or stakeholders.

Moreover, creating a sheet that correlates campaign send times with engagement metrics might reveal the optimal time for dispatching your emails to maximize opening rates. Similarly, analyzing the performance of A/B split campaigns can offer concrete data on which campaign variations perform the best, guiding future marketing strategies.

Utilizing the data import and analysis capabilities offered by Catchr and Google Sheets, marketers can unlock powerful insights into their email campaigns, enabling them to adjust strategies for better engagement and effectively measure ROI from their marketing efforts on Mailchimp.

Bonus : Your free Template Mailchimp - Campaign Overview Template

In this Mailchimp template, you will find all the metrics and dimensions you would need to get a better view of your data.

If you need more templates, you could look at our looker studio template gallery.

No items found.

In this Mailchimp template, you will find all the metrics and dimensions you would need to get a better view of your data thank to our integrations.

If you need more templates, you could look at our PowerBI template gallery.

Unlock Insights with Style!

Transform your marketing data into stunning dashboards.

Integrate, visualize, and impress with Catchr's seamless dashboards. Elevate your data game now!
Build your first report
14 days free-trial - No credit card required 🎉

More blog post about Mailchimp